articles related to dividend based investing
I cannot believe it! 2024 was crazy! Market notched 57 record closes on its way to end, with S&P500 up 23.31% and Nasdaq 28%. 2 back to back years of 20+% returns. Who would have thought? Here is my dividend income update for the year 2024 & what I did with my portfolio.
Dividend Income Update 2024
I made 8535.41 USD from my positions in 2024! It came from the following stocks and ETF’s:

This represents 44% increase as compared to last years dividend income update. Here is percentage breakdown of income from different stocks in the portfolio:

I am glad over 33% of dividends this year came from ETF’s (fixed income or equity). I will try and make this an even bigger pie in next year’s dividend income update !
My Buys in 2024
Too many buys to list out. But in addition to adding to my existing stocks like VTI, BND, VXUS, PFE, SBUX, PEP, ARE, TROW, O, here are the new positions I initiated in 2024:
Utilities were down a lot in the beginning of the year which gave me an opportunity to start a position in WEC Energy Group (WEC). They provide electricity and natural gas to multiple states in Midwest. It rarely goes at a 4% yield and I decided to pull the trigger then.
Humana (HUM) is in the business of providing health insurance to seniors mostly in Medicare Advantage section of the industry. It was a bad year for insurers due to multiple issues resulting in 40-45% drop in HUM’s stock price. I initiated a position in them and loaded up throughout the year.
First Industrial (FR) is a REIT that focuses on warehouses and logistics centers. REIT’s have been hammered down over rising rates and I decided to start my position in this.
Zoetis (ZTS) is a spinoff from Pfizer which focuses on animal healthcare. Animal health is a fast growing industry and ZTS is a leader in the industry. Decided to initiate a position when ZTS dropped in 140’s at beginning of 2024.
IBDS/IBDU iShares iBonds 2027/2029 Investment grade ETF’s. I came across these and these seem like a great idea. They are fixed maturity bond etf, that allow you to hold multiple investment grade bonds all of which expire by December of their maturity year. Unlike BND in which the yield and payout keeps changing as the underlying bonds mature and new bonds get added at prevailing yields. I though this product from Blackrock gave a more fixed yield which I know will end at its maturity. At the same time, I can hold multiple bonds in this ETF. Each share is 25$ face value and at maturity you are supposed to get it back (minus any per share impact of any company bonds in etf that defaulted of course) You can read more about it here and here.
My Sells and dividend cuts in 2024
Intel suspended its dividend this year which will impact my dividend income going forward. I need to re-evaluate if I want to keep the position in my portfolio or not, but their trouble seem to be never ending.
I sold out my positions in Phillip Morris(PM), Phillips 66 (PSX), Ally Financial Inc (ALLY) at or close to their highs in 2024. These were all very small positions and I did not see buying more of them to increase my dividend income, so decided to sell them to re-invest elsewhere.
Performance for the year 2024
My overall portfolio ended up at 14.32% for the year which is a big difference as compared to the market returns of 23% from VTI itself. Major laggard in my portfolio was about 20+% of fixed income (bonds, t-bills) that I now hold. Some of it might just be my emergency fund, some I might use in a downturn. Few more stocks contributing to underperformance were INTC, VFC both down about 50% from my cost basis.
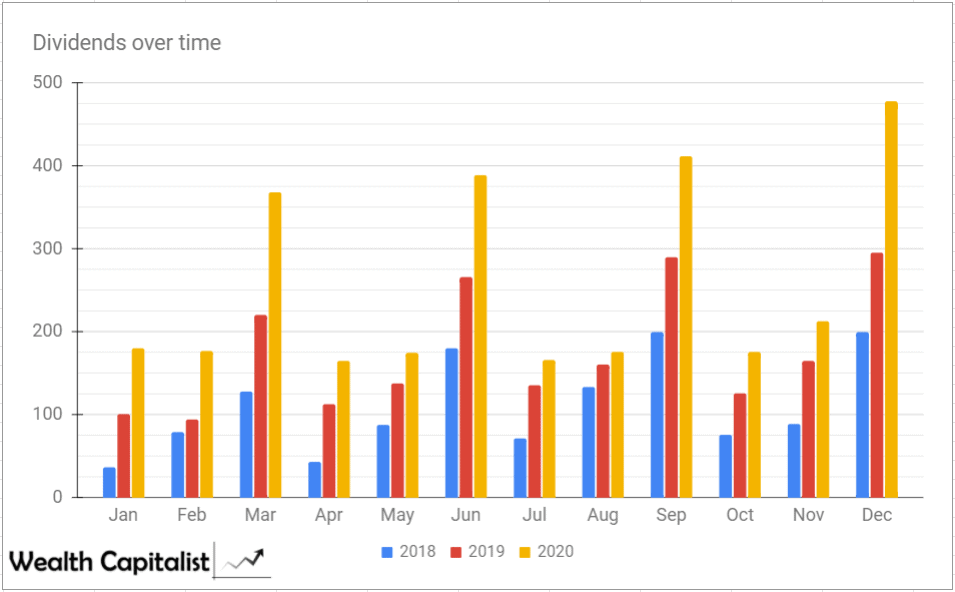
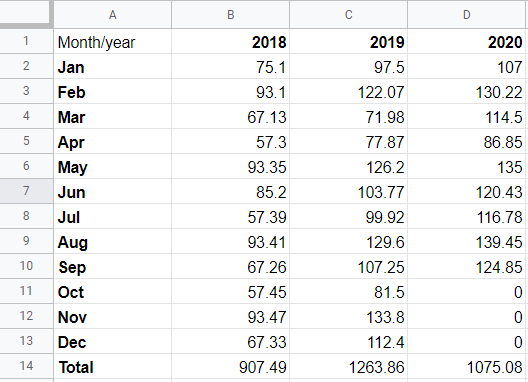
Here is a neat timeline of dividends thrown by my DGI portfolio over the last few years which shows compounding of dividend income in action.
Plans for 2025
With my current holdings, I am already looking at 9700$ in 2025 in dividend income. So the stretch goal would be to get to about 11K in dividend income in 2025. I want more of it coming from ETF’s again. Hopefully close to 45% from ETF’s would make it more safe.
Dividends stocks do come with some risk, but with precautions you can avoid the risky one’s and choose the best dividend paying/growing stocks for your portfolio. I prepared a guide where I discuss some key ratios, fundamentals, some important resources to look at while deciding to buy a dividend stock. Also find out how to get free access to Morningstar, Value Line, workaround paywall behind popular news sites like Seeking Alpha etc. Consider signing up for free instant access to the pdf version of the insights into dividend investing.


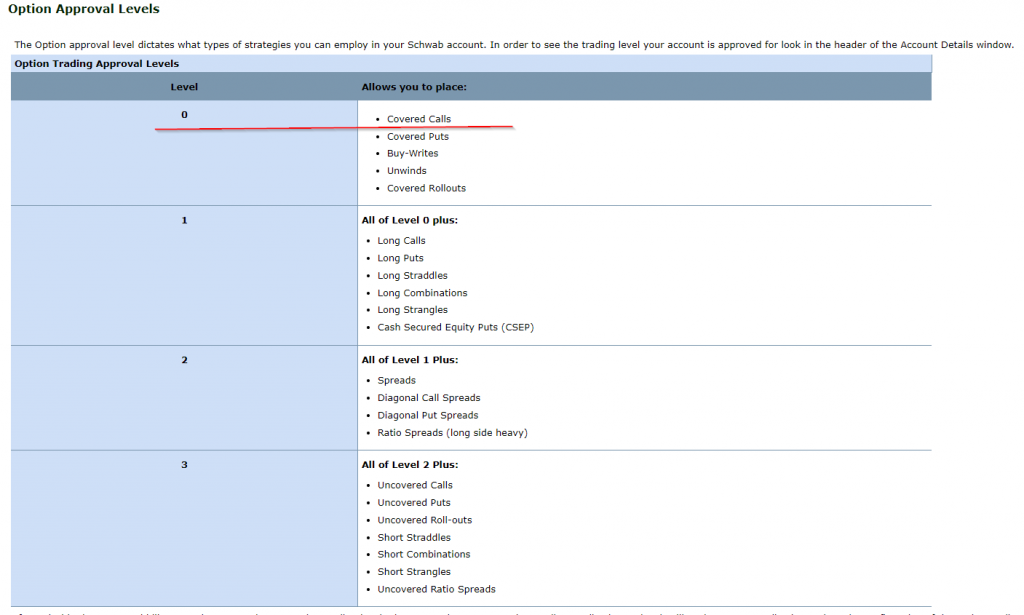


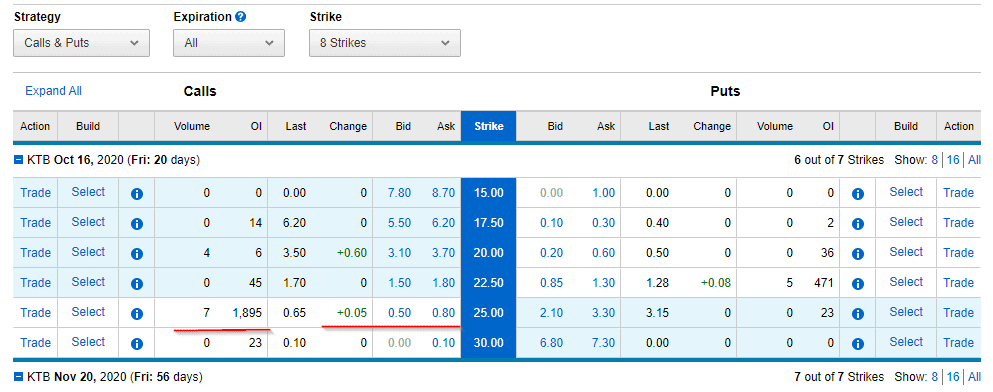 This is from a very recent screenshot, so numbers might not be accurate. Stock price was around 23$ at this time. What you see on left of the strike column are details for selling covered calls.
 That’s it!