I have been tracking my Dividend Growth Investing (DGI) portfolio for 3 years now & publishing since 2. I check up on my portfolio once every quarter. I wanted to present it in a way that is easy to understand and helps look at the benefits of dividend investing over the long term. Presenting a timeline of dividends my DGI portfolio kicks every quarter.
ANNUAL DIVIDEND INCOME UPDATE 2024
ANNUAL DIVIDEND INCOME UPDATE 2023
ANNUAL DIVIDEND INCOME UPDATE 2022
Annual Dividend Income Update 2021
Annual Dividend Income Update 2020
Quarterly Dividend Update: Q3 2020
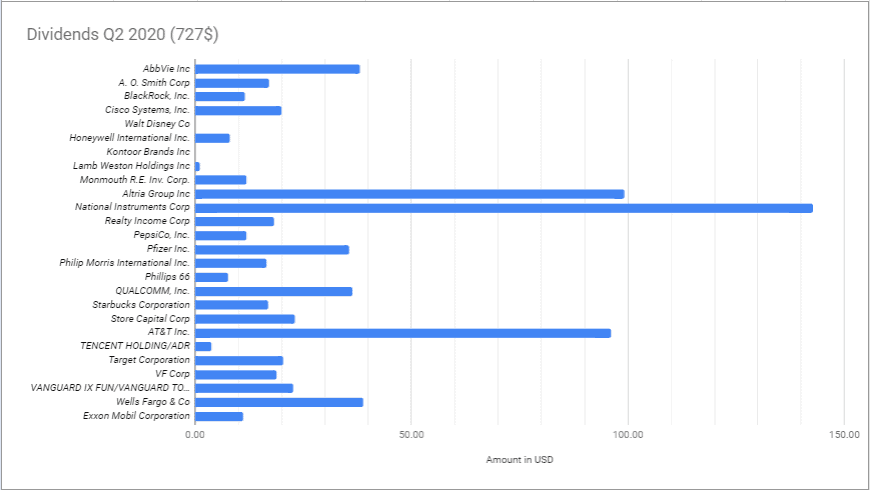
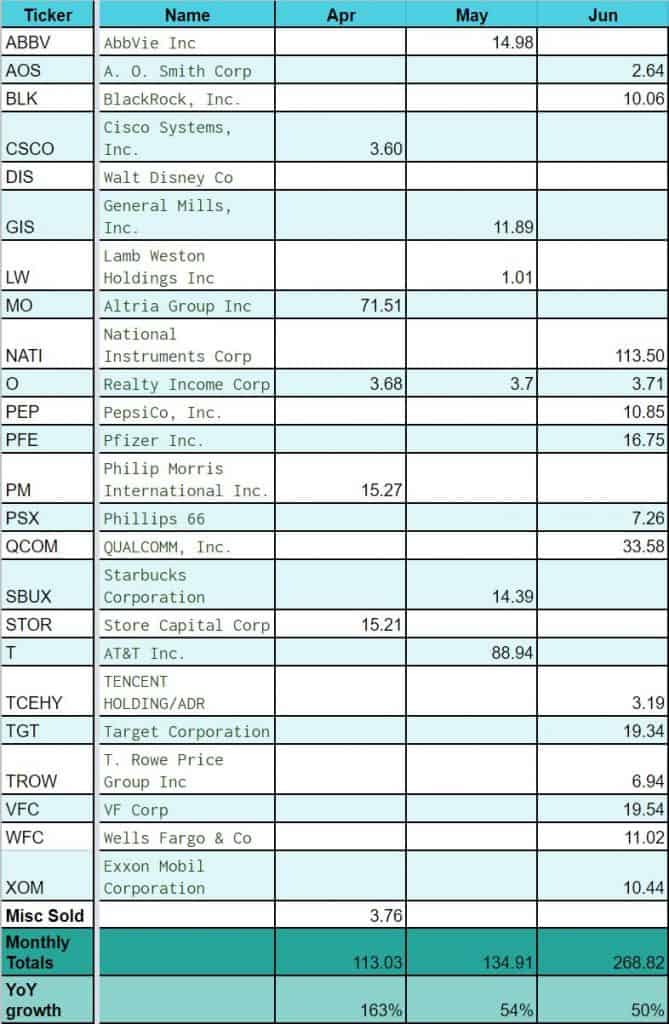
Quarterly Dividend Update: Q2 2020
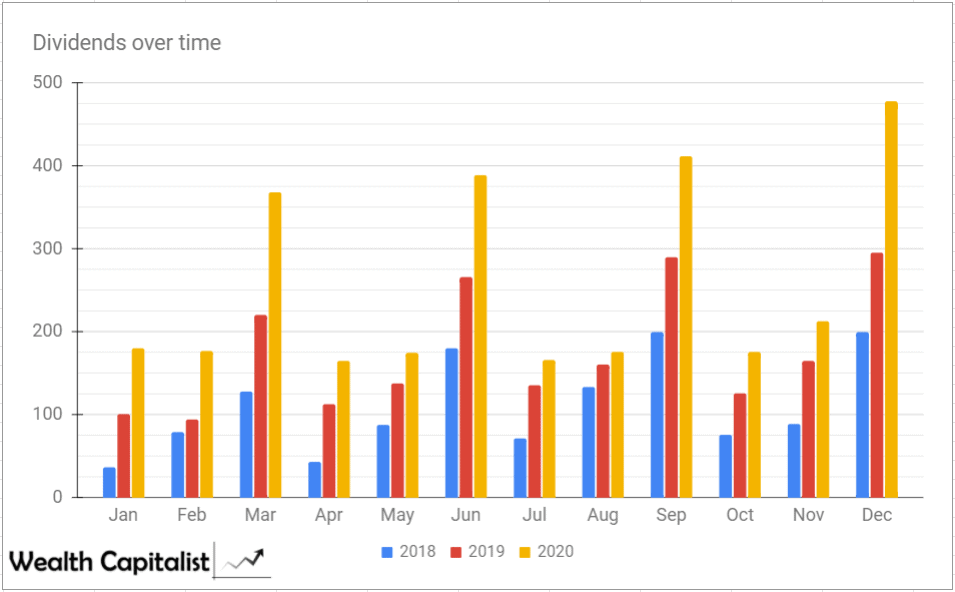
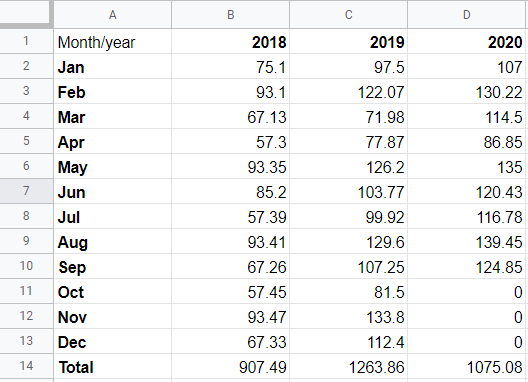
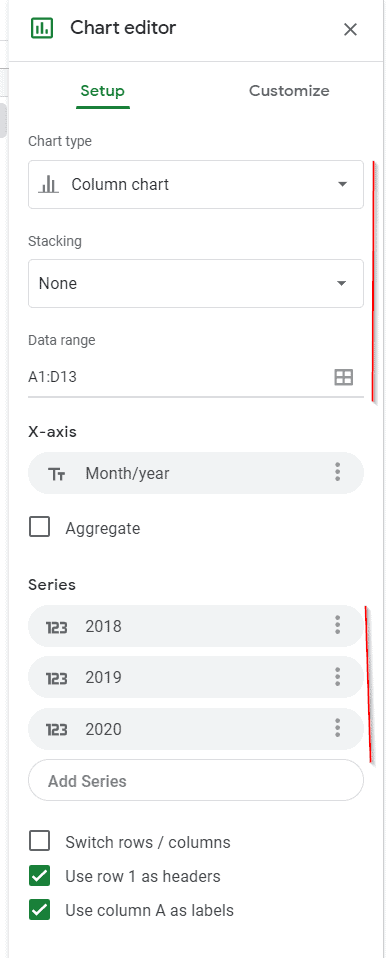
Feel free to click on any event on the timeline to read more details about that quarter. I also created a month over month dividends over time graph. It helps me visualize compounding effect of my DGI portfolio. You can see how dividends have increased every month over month, every year like clockwork!
Here is the latest sector breakdown of my DGI portfolio holdings at end of 2020:

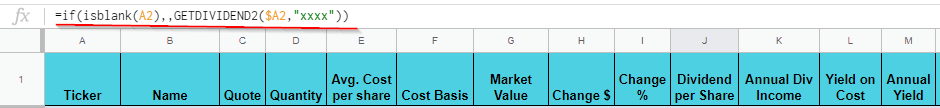
Check out how you can create your own dividend tracking google sheet with graphs and charts shown here.


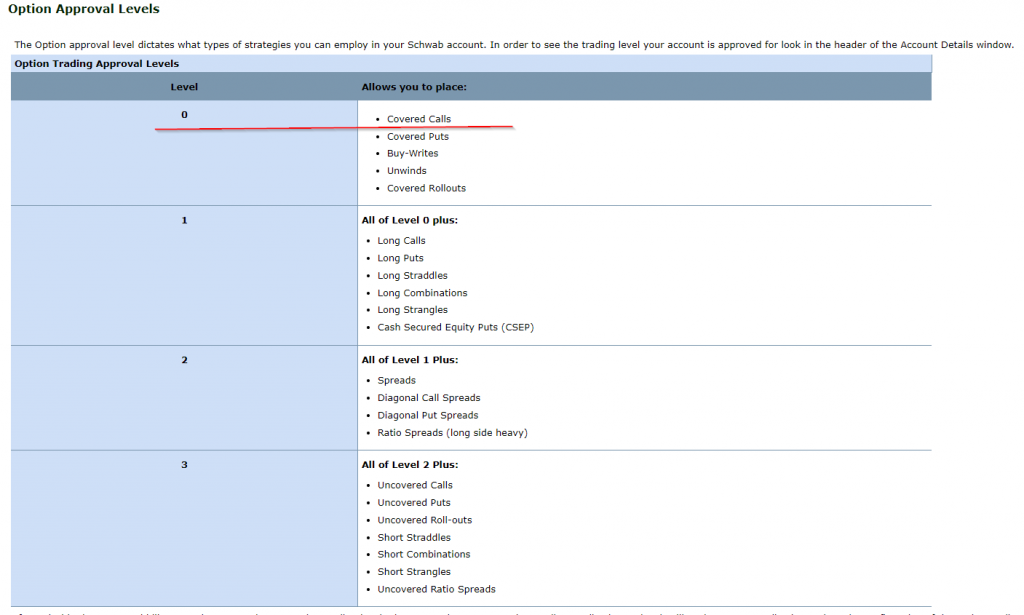


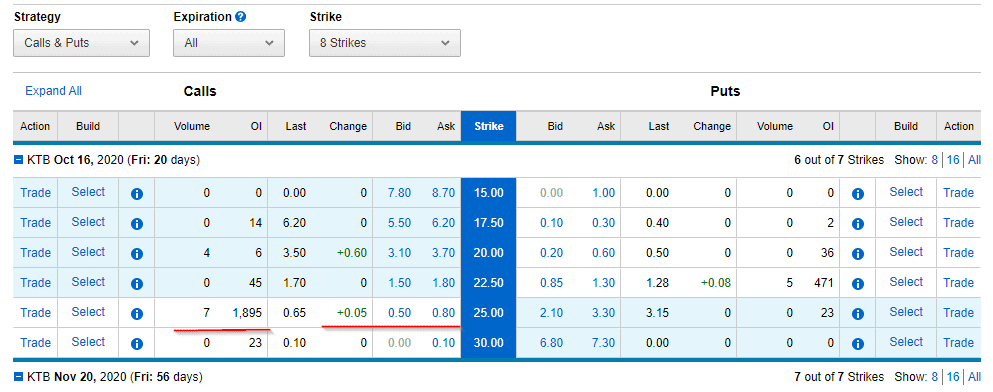 This is from a very recent screenshot, so numbers might not be accurate. Stock price was around 23$ at this time. What you see on left of the strike column are details for selling covered calls.
 That’s it!